 The Stereographic Projection Sphere
Stereographic Projection
• Stereographic projection is one of the convenient methods of projecting the linear and planar features.
• This method is used extensively for the determination of angular relationship among the lines as well as planes.
• In geotechnical engineering, it provides a quick and reliable picture of the discontinuities and their intersections.
• It is also used for estimation of cut slope angle, statistical analysis of joints, for the preparation of hazard maps and estimation of safety factors.
• The stereographic projection allows the three dimensional orientation data to be represented and analysed in two dimensions.
• Stereographic presentations remove one dimension from consideration so that lines or points can represent planes, and points can represent lines.
An important limitation of stereographic projections is that they consider only angular relationships between lines and planes, and do not represent the position or size of the feature.
Stereographic projection can be used in
• Landslide hazard/slope failure studies
• Earthquake studies
• Structural geological analysis
• Fracture analyses used in hydrogeology and/or groundwater pollution potentials
• Mining industry (fossil fuels included)
• Geotechnical Engineering
• Practically anything that deals with relative orientations of planes and lines
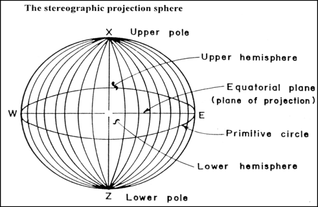
• The stereographic projection is the projection of the sphere.
• The sphere is divided into two equal hemispheres by a horizontal (equatorial)
plane and the upper and lower poles are fixed
• The plane of projection is the equatorial plane itself
• The circumference of the equatorial plane is called primitive circle.
• There are two type of projections- equal area and equal angle projection.
• The equal area projection also known as Lambert or Schmidt projection is generated by method where a point on the surface of the sphere is projected on the horizontal surface upon which it stands by swinging it in an arc centered at the point of contact of the sphere and the surface.
• This method is repeated for a number of points defined by the intersection of equally spaced longitude and latitude circles on the surface of the sphere to generated an equal area net.
• This net has larger diameter than the sphere and in order to reduce its diameter to that of the sphere, the radius of each point on the net is reduced by 1/√2.
• Equal angle projection also known as Wulff projection, is obtained by projection of a point on the surface of the sphere at the horizontal plane passing through the center of the sphere.
• This projection is defined by the point at which the horizontal plane is passing through the center of the sphere is pierced by a line from A to the zenith of the sphere.
• Both types of projection are used for the analysis of the structural geological data.
• Equal area net is divided into units of equal area and this permits the statistical interpretation of structural data.
• Engineers prefer to use the equal angle projection because geometrical construction required for the solution of geometrical construction required for the solution of engineering problems are simpler and more accurate on this projection.
• But as a whole there is no practical advantage to be gained by choosing one type of projection in preference to the other as pros and cons of both projections balance out each other when nets the used for the total solution of a problem.
• The projection of any line, plane or other geological structure can be done in two ways- lower hemispherical and upper hemispherical.
• Upper hemispherical projection is used in mineralogy, but in structural geology and engineering, lower hemispherical projection is used.
• Typically, it is as if you are looking into a hemispheric bowl sitting on the ground, and oriented along a N-S axis.
• Great circles look like lines of longitude, and represent where planes with a north-south strike but incrementally varying dips intersect the outer hemisphere surface.
• Small circles look like lines of latitude, and represent where cones with a north-south horizontal axis and incrementally increasing apical angles intersect the outer hemisphere.
• You can plot two types of features on a stereo net, a line (e.g. trend and plunge) and a plane (e.g. a strike and dip or dip direction and a dip).
• A line plots as a point and a plane plots as a great circle.
• All elements plotted pass through the center of the hemisphere, and their projection reflects where the plane or line intersects the outer hemispheric surface
• For plotting a line or a plane on a stereonet we use an overlay or a tracing paper placed over the net and attached at the centre point with a thumb-tack.
• The outline of the net or the circumference is traced on the overlay and the direction points (N,E, S and W) points are marked.
• The projection of the line or plane is thus obtained in the overlay with the help of the stereonet underneath it.
• A plane in a stereonet is represented by a curve known as great circle.
• Alternatively the plane can also be represented by a line perpendicular to it.
• This perpendicular line passing through the center of the sphere pierces the sphere at two diametrically opposite points which are called the poles of the great circle or the plane.
• Since only one hemisphere i.e. lower hemisphere is used in the analysis, only one pole is used.
• The pole is the point on the surface of the reference sphere that is pierced by a radial line in a direction normal to the plane.
• As any plane can be uniquely represented by a pole, another dimension can be reduced which help in analysis of structural problems.
Projection of a plane
Dip direction 130°, Dip 50°
• With the tracing paper located over the stereonet by means of the centre pin, trace the circumference of the net and mark the north point. Measure off the dip direction of 130° clockwise from north and mark this position on the circumference of the net.
• Rotate the tracing about the centre pin until the dip direction mark lies on the W-E axis of the net, i.e. the tracing is rotated through 40° . Measure 50° from the outer circle of the net and trace the great circle which corresponds to a plane dipping at this angle.
• The pole representing the plane is located by counting a further 90° division along the E-W axis while the 130 mark on the tracing paper is till aligned with this axis.
• The tracing is now rotated back to its original position so that the north mark on the tracing coincides with the north mark on the net.
• By using another net called the pole net, the pole of any plane can be plotted directly for further analysis.
• The pole net plots only the pole of a plane not a great circle.
• Pi diagrams are the projection of the poles of planar features whereas Beta diagrams the projections of planes rather than the poles.
Projection of a line
• When a line is plotted in a stereonet, it is represented by a point. The method is similar to plotting a plane. Here a point is marked instead plotting the great circle. In case of line, trend is plotted instead dip direction (in plane). Likewise, plunge is plotted instead of dip (in plane).
Intersection of two planes
• The intersection of two planes defines a line in space that is characterized by a trend (0–360◦) and plunge (0–90◦).
• In the stereographic projection, this line of intersection is defined as the point where the two great circles cross.
• The two intersecting planes may form a wedge shaped block and the direction in which this block may slide is determined by the trend of the line of intersection.
Angle between two lines
• Stereographic projection can be used to measure the angle between any two lines.
• First the lines are plotted and then then the overlay is rotated until these two points lie on the same great circle of the stereonet and the angle between the two lines is determined by counting the small circle divisions between the points along the great circle.
How to get Representative Joint sets ?
• To determine the mean value of a major discontinuity set or representative joint set is by means of statistical data concentration.
• At first, at least 50 data (dip direction/dip amount) are measured randomly from rock exposure.
• Pole of measured joints are plotted in stereo net and contoured in some range of data concentration.
• Maximum concentration gives the peak which represent the pole of representative joints.
Limitations
• Stereonet constructions are typically accurate to within 2 degrees because of tearing of the overlay at the pivot hole, parallax and plotting errors because the overlay is separated from the net, distortions in printing the net, and hand-eye coordination errors in plotting points and circles.
• With extra care most of these factors can be minimized to bring the accuracy to within a degree or so.
• The stereonet works because geologic structures can rarely be measured more precisely than within a couple of degrees or so.
• If an attempt is made to mix stereonet results with those derived by more accurate methods, like calculation, the end result will be only as good as the stereonet accuracy.
• Stereographic projection is one of the convenient methods of projecting the linear and planar features.
• This method is used extensively for the determination of angular relationship among the lines as well as planes.
• In geotechnical engineering, it provides a quick and reliable picture of the discontinuities and their intersections.
• It is also used for estimation of cut slope angle, statistical analysis of joints, for the preparation of hazard maps and estimation of safety factors.
• The stereographic projection allows the three dimensional orientation data to be represented and analysed in two dimensions.
• Stereographic presentations remove one dimension from consideration so that lines or points can represent planes, and points can represent lines.
An important limitation of stereographic projections is that they consider only angular relationships between lines and planes, and do not represent the position or size of the feature.
Stereographic projection can be used in
• Landslide hazard/slope failure studies
• Earthquake studies
• Structural geological analysis
• Fracture analyses used in hydrogeology and/or groundwater pollution potentials
• Mining industry (fossil fuels included)
• Geotechnical Engineering
• Practically anything that deals with relative orientations of planes and lines
• The stereographic projection is the projection of the sphere.
• The sphere is divided into two equal hemispheres by a horizontal (equatorial)
plane and the upper and lower poles are fixed
• The plane of projection is the equatorial plane itself
• The circumference of the equatorial plane is called primitive circle.
• There are two type of projections- equal area and equal angle projection.
• The equal area projection also known as Lambert or Schmidt projection is generated by method where a point on the surface of the sphere is projected on the horizontal surface upon which it stands by swinging it in an arc centered at the point of contact of the sphere and the surface.
• This method is repeated for a number of points defined by the intersection of equally spaced longitude and latitude circles on the surface of the sphere to generated an equal area net.
• This net has larger diameter than the sphere and in order to reduce its diameter to that of the sphere, the radius of each point on the net is reduced by 1/√2.
• Equal angle projection also known as Wulff projection, is obtained by projection of a point on the surface of the sphere at the horizontal plane passing through the center of the sphere.
• This projection is defined by the point at which the horizontal plane is passing through the center of the sphere is pierced by a line from A to the zenith of the sphere.
• Both types of projection are used for the analysis of the structural geological data.
• Equal area net is divided into units of equal area and this permits the statistical interpretation of structural data.
• Engineers prefer to use the equal angle projection because geometrical construction required for the solution of geometrical construction required for the solution of engineering problems are simpler and more accurate on this projection.
• But as a whole there is no practical advantage to be gained by choosing one type of projection in preference to the other as pros and cons of both projections balance out each other when nets the used for the total solution of a problem.
• The projection of any line, plane or other geological structure can be done in two ways- lower hemispherical and upper hemispherical.
• Upper hemispherical projection is used in mineralogy, but in structural geology and engineering, lower hemispherical projection is used.
• Typically, it is as if you are looking into a hemispheric bowl sitting on the ground, and oriented along a N-S axis.
• Great circles look like lines of longitude, and represent where planes with a north-south strike but incrementally varying dips intersect the outer hemisphere surface.
• Small circles look like lines of latitude, and represent where cones with a north-south horizontal axis and incrementally increasing apical angles intersect the outer hemisphere.
• You can plot two types of features on a stereo net, a line (e.g. trend and plunge) and a plane (e.g. a strike and dip or dip direction and a dip).
• A line plots as a point and a plane plots as a great circle.
• All elements plotted pass through the center of the hemisphere, and their projection reflects where the plane or line intersects the outer hemispheric surface
• For plotting a line or a plane on a stereonet we use an overlay or a tracing paper placed over the net and attached at the centre point with a thumb-tack.
• The outline of the net or the circumference is traced on the overlay and the direction points (N,E, S and W) points are marked.
• The projection of the line or plane is thus obtained in the overlay with the help of the stereonet underneath it.
• A plane in a stereonet is represented by a curve known as great circle.
• Alternatively the plane can also be represented by a line perpendicular to it.
• This perpendicular line passing through the center of the sphere pierces the sphere at two diametrically opposite points which are called the poles of the great circle or the plane.
• Since only one hemisphere i.e. lower hemisphere is used in the analysis, only one pole is used.
• The pole is the point on the surface of the reference sphere that is pierced by a radial line in a direction normal to the plane.
• As any plane can be uniquely represented by a pole, another dimension can be reduced which help in analysis of structural problems.
Projection of a plane
Dip direction 130°, Dip 50°
• With the tracing paper located over the stereonet by means of the centre pin, trace the circumference of the net and mark the north point. Measure off the dip direction of 130° clockwise from north and mark this position on the circumference of the net.
• Rotate the tracing about the centre pin until the dip direction mark lies on the W-E axis of the net, i.e. the tracing is rotated through 40° . Measure 50° from the outer circle of the net and trace the great circle which corresponds to a plane dipping at this angle.
• The pole representing the plane is located by counting a further 90° division along the E-W axis while the 130 mark on the tracing paper is till aligned with this axis.
• The tracing is now rotated back to its original position so that the north mark on the tracing coincides with the north mark on the net.
• By using another net called the pole net, the pole of any plane can be plotted directly for further analysis.
• The pole net plots only the pole of a plane not a great circle.
• Pi diagrams are the projection of the poles of planar features whereas Beta diagrams the projections of planes rather than the poles.
Projection of a line
• When a line is plotted in a stereonet, it is represented by a point. The method is similar to plotting a plane. Here a point is marked instead plotting the great circle. In case of line, trend is plotted instead dip direction (in plane). Likewise, plunge is plotted instead of dip (in plane).
Intersection of two planes
• The intersection of two planes defines a line in space that is characterized by a trend (0–360◦) and plunge (0–90◦).
• In the stereographic projection, this line of intersection is defined as the point where the two great circles cross.
• The two intersecting planes may form a wedge shaped block and the direction in which this block may slide is determined by the trend of the line of intersection.
Angle between two lines
• Stereographic projection can be used to measure the angle between any two lines.
• First the lines are plotted and then then the overlay is rotated until these two points lie on the same great circle of the stereonet and the angle between the two lines is determined by counting the small circle divisions between the points along the great circle.
How to get Representative Joint sets ?
• To determine the mean value of a major discontinuity set or representative joint set is by means of statistical data concentration.
• At first, at least 50 data (dip direction/dip amount) are measured randomly from rock exposure.
• Pole of measured joints are plotted in stereo net and contoured in some range of data concentration.
• Maximum concentration gives the peak which represent the pole of representative joints.
Limitations
• Stereonet constructions are typically accurate to within 2 degrees because of tearing of the overlay at the pivot hole, parallax and plotting errors because the overlay is separated from the net, distortions in printing the net, and hand-eye coordination errors in plotting points and circles.
• With extra care most of these factors can be minimized to bring the accuracy to within a degree or so.
• The stereonet works because geologic structures can rarely be measured more precisely than within a couple of degrees or so.
• If an attempt is made to mix stereonet results with those derived by more accurate methods, like calculation, the end result will be only as good as the stereonet accuracy.
Source: http://folk.uib.no/nglhe/e-modules/Stereo%20module/1%20Stereo%20new.swf
