Plasticity of Soil
It is the property of soil by which it undergoes deformation without cracking or fracturing.
Criteria:
i. The soil should be clay.
ii. Presence of water
Negative charges are present on the surfaces of clay particles. The water molecules are dipolar and hence they are attracted towards the surfaces of clay particles. This process is known as adsorption of water. This adsorbed water contributes to the plasticity of the soil since it allows the clay particles to slip over one another.
The soil particles, on being subjected to deformations, do not revert back to their original positions. Hence, the deformations are plastic. As the water content of the soil is gradually reduced, this plasticity property is also reduced. Ultimately, when the soil becomes dry, the particles are cemented together as a solid mass.
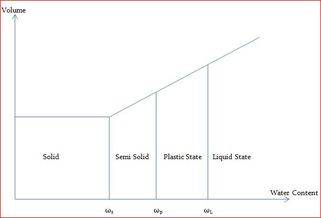 Different States of Soil
Consistency Limits / Atterberg's Limits
Consistency Limits represent the water contents at which the soil changes from one state to another state.
Liquid Limit
It is the water content at which soil changes from liquid state to plastic state or it is the minimum water content at which soil just begins to flow. It is denoted by ωL.
Consistency Limits represent the water contents at which the soil changes from one state to another state.
- Liquid Limit
- Plastic Limit
- Shrinkage Limit
Liquid Limit
It is the water content at which soil changes from liquid state to plastic state or it is the minimum water content at which soil just begins to flow. It is denoted by ωL.
Plastic Limit
It is the water content at which soil changes from plastic state to semi-solid state or it is the minimum water content at which soil rolled into threads of 3 mm diameter just crumbles. It is denoted by ωP.
It is the water content at which soil changes from plastic state to semi-solid state or it is the minimum water content at which soil rolled into threads of 3 mm diameter just crumbles. It is denoted by ωP.
Shrinkage Limit
It is the water content at which the soil changes from semi-solid state to solid state or it is the maximum water content at which further reduction in the water content will not cause decrease in the volume of soil. It is denoted by ωs.
It is the water content at which the soil changes from semi-solid state to solid state or it is the maximum water content at which further reduction in the water content will not cause decrease in the volume of soil. It is denoted by ωs.
Determination of Plastic Limit
Hence, plastic limit can be defined as the water content at which the soil can be rolled into a thread of approximately 3 mm in diameter without any crumbling.
- Take soil sample (100 gm) passing through 425μ sieve.
- Mix with distilled water.
- Put it on the palm or on the glass and roll till
- diameter of thread becomes 3 mm
- cracks appear
- Find the water content, which is the required plastic limit.
Hence, plastic limit can be defined as the water content at which the soil can be rolled into a thread of approximately 3 mm in diameter without any crumbling.
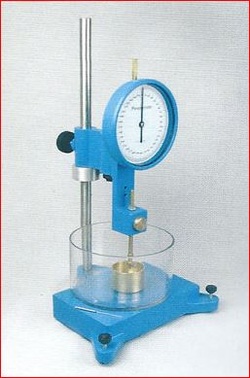
 Cone Penetrometer Method
Determination of Liquid Limit
1. Cone Penetrometer Method
1. Cone Penetrometer Method
- Height of cone = 35 mm
- Apex angle of cone = 30 degrees (tolerance = 1 degree)
- Disc + rod + cone = 80 gm (tolerance = 0.05 gm)
- Soil sample = 50 mm diameter, 50 mm height
- Soil passing through 425 micron sieve is taken and mixed with distilled water.
- Keep it in the cup.
- Release the cone for 30 seconds.
- Measure the penetration in mm.
- Repeat the procedures for 3 more times at different water contents.
- The water content at each case is determined.
- Plot water content vs. penetration in normal graph.
2. Cassagrande's Method
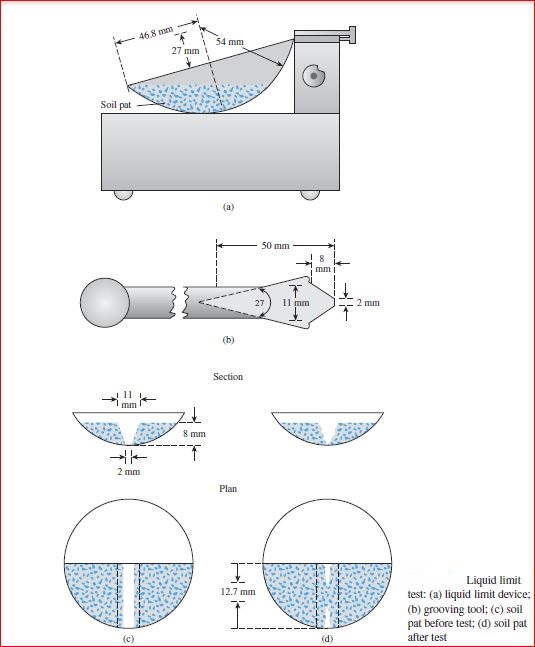
- Soil passing through 425 micron sieve is taken.
- Mix with distilled water.
- Keep it in the brass cup.
- Cut the soil by grooving tool into two halves.
- Rotate the handle at 2 rev/s till the two halves of soil touch for a length of 12 mm.
- Note down the number of revolutions (number of blows).
- Find out the water content.
- Repeat the procedures for three more samples.
- Standard value of number of blows (N) = 25 (tolerance = 15). Hence, the standard number of blows ranges from 10 to 40.
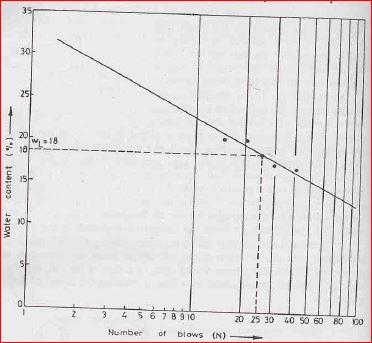
- Plot number of blows versus water content on a semi-log graph.
- The number of blows is plotted in X-axis in log-scale.
- The water content corresponding to 25 number of blows is taken as liquid limit.
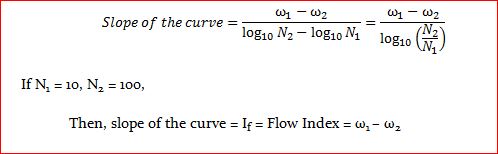
- The curve obtained is known as flow curve. The slope of this curve is known as flow Index (If).
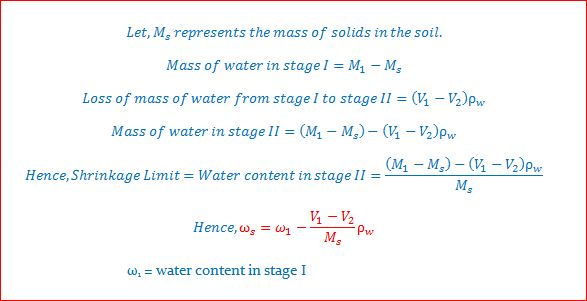
Determination of Shrinkage Limit
Shrinkage limit indicates the lowest water content of the soil at which it remains saturated. It is the maximum water content at which further reduction in the water content will not caused a decrease in the volume of the soil.
Shrinkage limit indicates the lowest water content of the soil at which it remains saturated. It is the maximum water content at which further reduction in the water content will not caused a decrease in the volume of the soil.
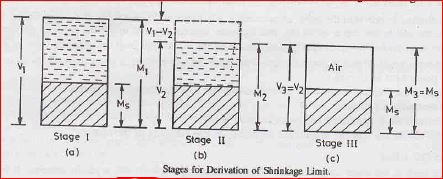
Figure (a) shows a soil sample which is fully saturated and has the water content greater than the expected shrinkage limit. In figure (b), the soil sample is at shrinkage limit. Finally, figure (c) depicts the condition when the soil sample has been oven-dried. Hence, the total volume in third figure is the same as the volume in second case.